· 3 min read
Vanuatu Energy Dashboard

This project was my first dive into data science and can be interacted with at vanuatu-energy-dashboard-app.herokuapp.com *(this may have been true but now I’m migrating to my new domain so it is offline now) or source code can be found on Github. It’s also an excuse to finally play around with Dash, a tool for building data rich websites using Plotly. All-in-all it took only a couple days to put together once I had the data. The data took a bit longer to gather since I had to collect it from various sources and mostly from PDF reports. But, I did automate the data fetching and processing steps in my code so that future updates are seamless.
Background
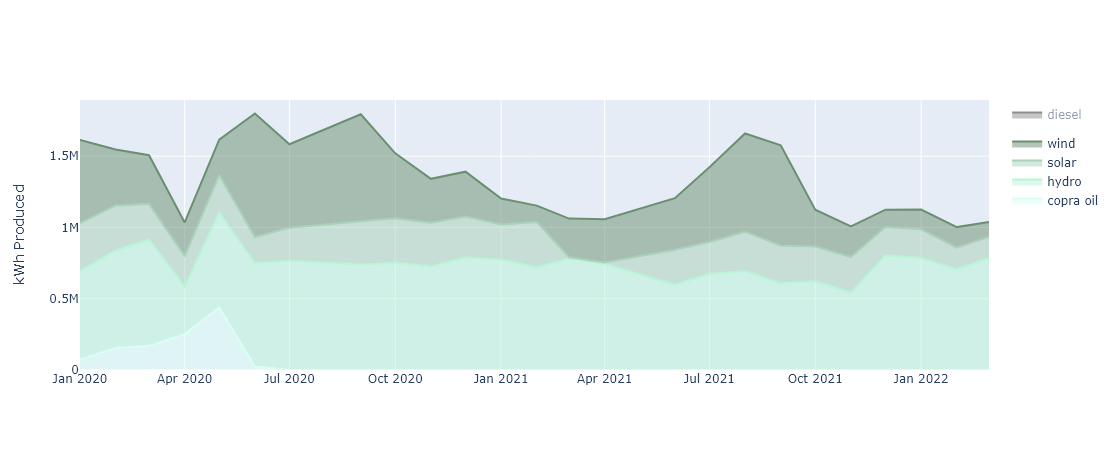
In Vanuatu there is pretty much one utility company, Unelco, and electricity prices have been rising steadily even before the war in Ukraine began. I thought investigating the relationship between electricity prices and fuel prices, the majority of Unelco power produced is from diesel, would be an interesting topic for learning a bit about data science.
Data Sources
All sources and raw data are available in the Github repo.
At the moment I have a few sources of data. I have two local sources, both monthly PDF reports, one tariff rate report from Unelco and the other an affordability report from the utility regulator (URA).
My third source of data, crude oil price averages, are a substitute for local diesel costs until I can obtain that data locally. To help make the price comparison more accurate I used exchange rate data to match the month of the crude oil price and converted from USD/barrel to Vatu/barrel.
The Department of Energy has been slow to return my messages for the data they use for their sporadic fuel price announcements. I do not want to deal with trying to scrape the announcements as they are inconsistently released and some such as this one show they clearly have daily fuel cost information internally. But, I guess it could make for an interesting NLP project.
Data Issues
First of all, Unelco has been great through this project. They outright delivered past data upon request which is an unheard of level of service in Vanuatu. So no issues there.
I first found problems with the URA since they have completely stopped releasing their reports since March of 2022. They also seem to have at least one monthly report missing every year. Not to mention something happened in March of 2020 where simply no data was really collected but a report was still released.
Conclusions
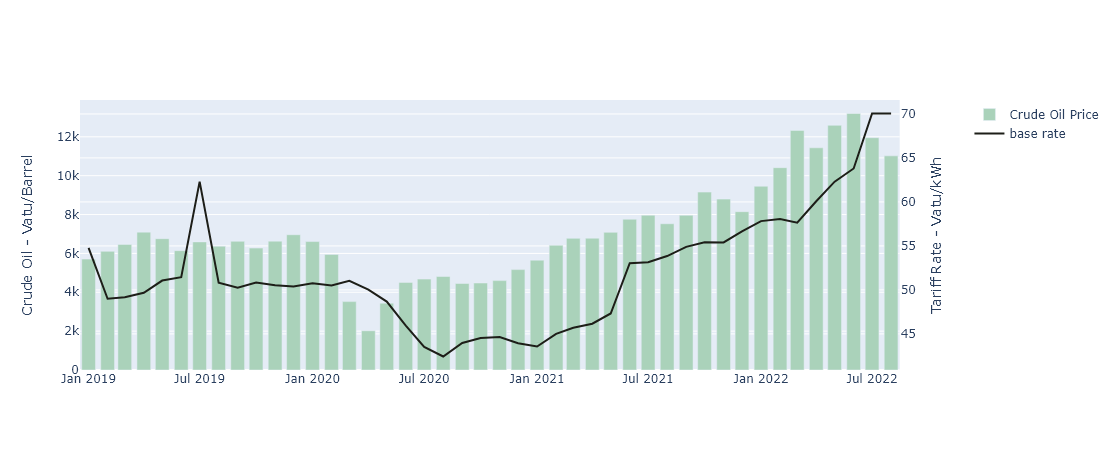
I don’t believe much can be concluded, I’m not a professional just some guy playing around with public data after all. Although you can see that Vanuatu is not actively transitioning to renewable sources of energy, over the years the total amount energy produced by renewable sources has stagnated. But, I will say I am most surprised that the tariff rate appears to rise slowly with fuel costs and drop quickly with fuel costs. So good on you Unelco, I never expected that.
- data-science
- python
- dash